
[et_pb_section bb_built=”1″][et_pb_row][et_pb_column type=”4_4″][et_pb_text _builder_version=”3.0.64″ background_layout=”light” text_orientation=”left” text_font=”Roboto||||” text_font_size=”14px” text_text_color=”#4d4d4d” border_style=”solid”]
Asset Growth of Commercial Banks in Quarter 4 FY2073/74
Despite the economic challenges and liquidity crunches in FY 2073/74, Commercial Banks in Nepal are able to show adequate growth by end of FY 2073/74. All of the A class licensed financial institutions have published its 4th quarter report for the FY 2073/74 by the 5th of Bhadra. The comparisons of asset growth are shown in the table by computing Year on Year growth figures as well as Quarterly growth rates. The growth of the banks is segregated on the basis of organic and inorganic growth. Inorganic growth is where the company’s growth figures are influenced by the company’s corporate activities such as mergers and acquisitions, whereas organic growth is a situation where the company’s growth figures are not influenced by these activities and the growth is purely driven by its performance.
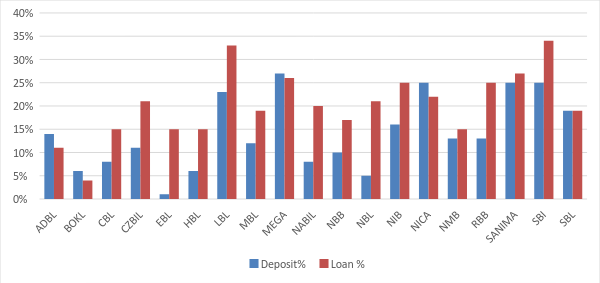
The average deposits and loan growth rates of banks are 15% and 21% respectively. Eight banks have managed to achieve the deposit and the loan growth rates that are higher than the industry average. They are: MEGA, SANIMA, SBI, NICA, LBL, SBK, SRBL, and SCB.
On the other hand, EBL, NBL, BOKL, HBL, and NABIL are amongst the poor performers in terms of deposit growth. Nevertheless, in terms of the loan growth EBL, NBL, HBL, and NABIL were in par with the industry average. This means that these banks have tightened their CCD ratio in order to increase their business. Similarly, BOKL and ADBL are the two banks with the comparatively lower loan growth rate.

| Table 1 | ||
| Company | Deposit % | Loan % |
| ADBL | 14% | 11% |
| BOKL | 6% | 4% |
| CBL | 8% | 15% |
| CZBIL | 11% | 21% |
| EBL | 1% | 15% |
| HBL | 6% | 15% |
| LBL | 23% | 33% |
| MBL | 12% | 19% |
| MEGA | 27% | 26% |
| NABIL | 8% | 17% |
| NBB | 10% | 17% |
| NBL | 5% | 21% |
| NIB | 16% | 25% |
| NICA | 25% | 22% |
| NMB | 13% | 15% |
| RBB | 13% | 25% |
| SANIMA | 25% | 27% |
| SBI | 25% | 34% |
| SBL | 19% | 19% |
| SCB | 15% | 25% |
| SRBL | 18% | 21% |
With regards to the banks which have had inorganic growth this year, i.e. growth figures arising from mergers and takeovers, are JBNL, NCCB, KBL, CCBL, GBIME, PCBL and PRVU. These companies have managed to grow their asset by more than 30% because of mergers and acquisitions.
Therefore, the asset growth figures for these banks could not be compared against the banks that not get involved in mergers and acquisitions. Table 2 represents the growth of asset and deposit liabilities of banks that have gone through mergers and acquisition activities.
| Table 2 | ||
| Deposit % | Loan % | |
| JBNL | 102% | 123% |
| NCCB | 94% | 96% |
| KBL | 56% | 72% |
| CCBL | 47% | 60% |
| GBIME | 36% | 33% |
| PCBL | 36% | 43% |
| PRVU | 33% | 41% |
[/et_pb_text][/et_pb_column][/et_pb_row][/et_pb_section]